
As part of our ongoing series of D2D Self-Publishing Insider Insights, here’s a look at some of the data we’ve been tracking related to Q1 (Jan/Feb/Mar) and Q2 (Apr/May/Jun) sales from 2022.
These sales are pulled from the aggregated sales from Draft2Digital’s retail and library partners as well as from the Smashwords aggregated sales from retailers, libraries and the Smashwords store. (The D2D and Smashwords database systems are not yet merged so the sales are currently still stored, pulled, and reported separately.)
Before we get into looking at some specific data points, here are some industry trends we’ve been tracking to help set the stage.
LIVESTREAM - Listen in on the D2D team as they discuss these industry insights!
Since about March/April 2022, there has been an “across-the-board” drop of book sales. This is being noted in both indie publishing and traditional publishing. It can most likely be attributed to the reduction and removal of pandemic-related lockdowns and restrictions on different activities outside the home as well as international travel.
In the same way that March 2020 saw unprecedented triple-digit growth across eBook sales via both libraries and retailers, the spring of 2022 saw a similar rebound back to normal numbers. In comparison to 2020 and 2021 year-over-year data, the 2022 data might be a sign of bad things. But we took the time to look at 2019 compared to 2022 to get a more realistic expectation of whether things were actually going down or were just normalizing back to the similar gradual growth they’d been on.
In a nutshell, we can confirm that sales in 2022 are definitely trending in a consistent pattern to where they were in 2019. And we’ll have to take the uncharacteristically high sales numbers of 2020 and 2021 with a bit of a grain of reality.
Several members of the Draft2Digital team were in attendance at NINC this past September, and, on top of the amazing learning and content there each year is Lou Aronica’s “summary” presentation given at the very end of the conference. Lou is an author, editor and publisher with decades of experience in traditional publishing, having acquired and edited books for Bantam, Berkley, and Avon, successfully creating new imprints and working with bestselling authors like J.D. Robb (Nora Roberts’ alter ego), Elizabeth George, Robert Crais, and Diane Mott Davidson. An author who is knowledgeable and experienced in both traditional and indie publishing, Lou currently runs The Story Plant, a traditional publisher with a dynamic and indie spirit. His insights into the industry are wonderfully inclusive and on point.
This year, a highlight of a couple of the things Lou pointed out are below, followed by my commentary on them.
Apart from audiobook sales, Trade Paperbacks are the fasted growing format in book sales. And that for traditional publishers, only about 20% of their revenue comes from eBook sales.
This, to me, is a reminder that indie authors still have a huge advantage in leveraging their lead and flexibility with eBook publishing. March 2020 SHOULD have been an opportunity for publishers to see a different way of thinking – to stop thinking of eBook sales as cannibalizing their print books sales. But most of them didn’t. They continued to operate in a completely different business that is mostly dependent upon stockpiling dead tree products in warehouses and distributing them through brick-and-mortar locations. That business, of course, isn’t going away, if anything, it’s growing. Indie bookstores, for example, are growing (yes, even in the past couple of years) in both the US and Canada. Once publishers start to really pay attention to what’s possible in the realm of eBooks, indie authors might no longer have all the same advantages.
All signs from experts point to the fact we’re heading into a significant recession. Books have historically been recession-proof. But this will be the first meaningful recession since the streaming era began. What will that mean in terms of books being able to compete? It’ll be interesting to watch.
As Lou points out, books have been able to survive recessions effectively. But it’s one thing to consider the cost of (for example) going to the movies and the 2 hours of entertainment compared to the 8 to 10 hours of entertainment from a book. But when those movies are easily accessible in the home without the additional expenses of a babysitter, gas prices, popcorn and drinks, and movie tickets, that gigantic value for the entertainment dollar of a book isn’t as dramatic. It’ll be interesting to see. But one thing is certain, and this is also something Lou pointed out: People who love books REALLY love books. They define themselves as book lovers. Those people are likely the ones who will double down on their reading convictions. And thank goodness for them. Because, as Lou says: “There is an enormous consumer base that wants what we create: Books.”
But now that our look at the overall industry and some of the trends we’ve been tracking are over, let’s dig into data more specifically from Draft2Digital and Smashwords.
Draft2Digital
Here are some high-level looks at trends in the sales from Draft2Digital’s retail and library channels.
The first thing to note is that 2020 was a dramatically higher year over 2019. And 2021 also saw healthy and larger-than-normal growth. This was some of the most significant growth in sales since what many people call those “Kindle Gold Rush” days of 2009 to 2014.
- When comparing Q1 & Q2 of 2022 to Q1 & Q2 of 2021, unit sales are down about 1% (0.97%) and revenue is down 4.82%
But just remember, as we discussed earlier, it’s almost unfair to compare this “pandemic rebound” era to the unprecedented growth of 2020 and 2021. So, to gauge a longer-term view, how does 2022 stack up to the last previous “normal” year?
- Compared to 2019, units have grown by 3.98% and revenue has grown by 9.93%
This larger revenue growth is an interesting number to pay attention to, as it means authors are earning more than twice as much as they are selling when looking at the first two quarters of 2019 compared to the same period for 2022.
It means that more authors are selling titles at slightly higher than “bargain basement” prices. They are likely taking advantage of the fact that traditional publishers are pricing ridiculously higher, so even if, in some genres, they walk their prices up a dollar or two, their books are still $8 to $10 lower than the average price of an eBook from a major publisher. So, the price is a bit higher, but still provides great value for a reader. The growth in library sales, particularly since March 2020, has likely also been a contributing factor. We look at library growth a little more below, but again, library sales are growing, and authors typically price their eBooks to the library market at 2 to 3 times the retail price. That increases the margin earned per unit sale in a positive manner.
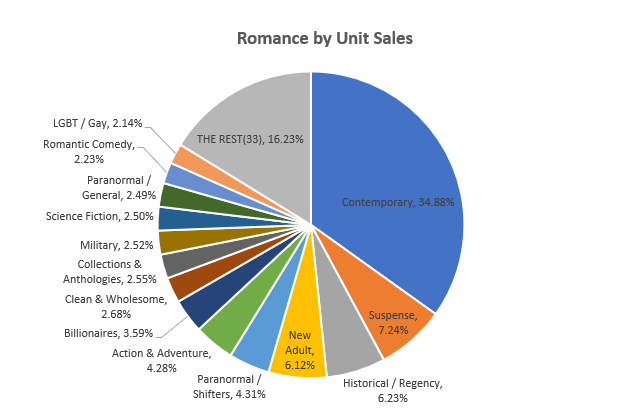
- Romance sales account for (again) the majority of Draft2Digital sales. 55% of units and 55.06% of revenue
This should come as no surprise to anyone. Romance has long been the powerhouse genre within eBook publishing. Romance provides readers with a sure thing. A happy ending. And, particularly in the frustrations, struggles, and challenges of the past couple of years, turning to a genre where you know there’ll be a happy ending has likely been more important than ever before.
But something to note about the 55% unit and 55.06% revenue growth is that indie authors seem to be pricing their romance titles “just right” for the market. The unit grow and the revenue growth are neck and neck. Romance authors, as they often are, demonstrate their ability to be brilliantly analytical and savvy businesspersons. They have optimized the prices of their products to ensure maximum volume and maximum value for both their readers and for their own margin and earning potential.
- The top 25 most popular categories are:
- FICTION / Romance
- FICTION / Mystery & Detective
- FICTION / FANTASY
- FICTION / Erotica
- FICTION / WOMEN
- FICTION / Science Fiction
- FICTION / Action & Adventure
- BUSINESS & ECONOMICS
- FICTION / Thrillers
- FICTION / CRIME
- YOUNG ADULT FICTION
- FICTION / Christian
- SELF-HELP
- BODY, MIND & SPIRIT
- HEALTH & FITNESS
- COOKING
- FICTION / Fairy Tales, Folk Tales, Legends & Mythology
- FICTION / LGBT
- FAMILY & RELATIONSHIPS
- FICTION / FAMILY LIFE
- FICTION / HISTORICAL
What’s most interesting to note is that, while the main genres are at the top of the list, there are a few fiction categories that have moved a bit higher. Namely, Women’s, Christian, LGBT, Family Life, and Historical. In addition, several of the non-fiction categories have grown, including Business & Economics, Self-Help, Body, Mind & Spirit, Health and Fitness, and Cooking.
It's fascinating to see Cooking ranking so high. It has, “traditionally” within eBooks, been a slow to grow category. That’s because of the preferred “fixed layout” format that has long been the preference. Physical copy books that can be kept in or near the kitchen. Is this an indication that eBook adoption is expanding well beyond fiction and the usual “text-based” book?
- Series Units are 75.48% of sales and 75.94% of Revenue
Just like finding Romance is, by far, the bestselling category, it should come as no surprise to anyone who has been paying attention in the indie author space that series books are the best-performing titles.
This remains an area where indie authors can easily surpass, and even publish circles around traditional publishers. Most traditional publishers are still sticking to a single book per year for most successful series books they publish, while indie authors aren’t bound to the four-season selling to bookstore buyers cycle and can release books more rapidly, keeping up with customer demand at a far quicker pace.
Many authors use a reduced price or free first book in series strategy to help funnel readers into their series titles. It remains an effective strategy.
- We continue to see evidence, within both retail and library channels, of the first book in series strategy really working to funnel readers into a new series.
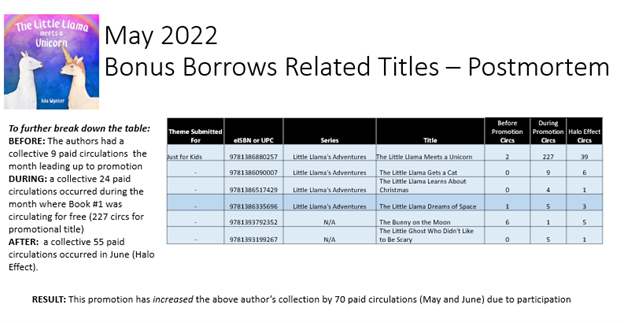
Case in point is the Hoopla “Bonus Borrow” program for libraries. Within the program Dreamscape/Hoopla offers their library partners a curated selection of books with unlimited CPC (Cost per checkout) borrows for a full month. They tend towards selecting first books in series with at least three books or more in the total series. They tracked the number of circulations each title had in the month before the promo, how many circulations occurred during the “bonus borrow” month, and how many paid circulations occurred for that first book and the rest of the series, in the month following the promotion.
Only a single title turned out to be a relative “bust” in seeing no circulation during the bonus program, and only 2 paid circulations in the after-effect halo. But for the rest of the titles in the program, there was a definite increase in paid circulation.
Here are the totals from the May program
|
Circulation Before Promo |
Circulation During Promo |
Circulation After Promo (Halo Effect) | ||
|
14 |
2587 |
228 |
The total circulation of all the series titles for the 10 authors in the month before the promo was 14. The total circulation during the promo period was 2587. (This includes both the free circulation of that 1st in-series book, but also, a small number of paid circulations on the other titles in the same series). And in the month following the total overall circulation (all paid) was 228. This shows a growth of 214 circulations from the before to after period.
Here's how the average set of titles per author in that promo performed
|
Circulation Before Promo |
Circulation During Promo |
Circulation After Promo (Halo Effect) |
| |
|
1.4 |
258.7 |
22.8 |
You’ll notice that the average paid circulation number went from about 1 to 23. That’s a significant growth.
To illustrate the details from one of the 10 authors who participated in this promo, here’s a look at their unique chart (which they have given permission for us to share)
Draft2Digital is obviously going to continue to help Dreamscape/Hoopla curate more titles for this program on an ongoing basis.
- Library Sales continue to be an important part of sales growth for indie authors
- Despite the slowdown, total library units grew by 4.28% when comparing the 1st 6 months of 2021 to the 1st 6 months of 2022
- Total growth of Library Units in the past several years (Looking at Jan to June)
- 2019 to 2020 - +107%
- 2020 to 2021 - +226.64%
- 2021 to 2022 - +4.28%
- The biggest growth in library units is with CPC (Cost Per Checkout)
- 2019 to 2020 – 1252.30%
- 2020 to 2021 – 203.19%
- 2021 to 2022 – 6.15%
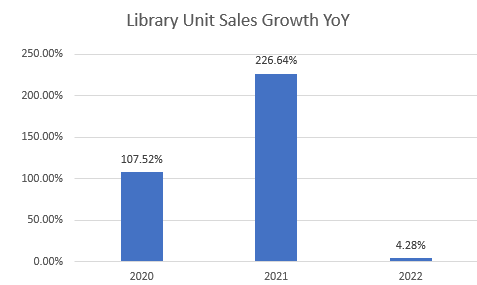
It’s important to note that, while YoY growth in library sales has “slowed down” it’s still positive growth. And that 4.28% of a much larger number is still a significant growth compared to double-digit growth of a lower value. Library unit sales and revenue are in the multi-six-figure range – so we’re not talking about small potatoes here.
Library sales growth, when comparing 2019 to 2022 unit sales, saw an increase of 4252%. So don’t let that YoY between 2021 and 2022 fool you into thinking that library sales are doing anything but increasing.
- D2D Print is growing. D2D Print has seen a 220% growth in the first half of 2022 compared to the same period in 2021.
That’s more than 3X growth. And we’ve ONLY just barely begun, as D2D Print has been in beta release, with just under 2% of our authors having made print books.
As of late Sept 2022, there are approximately 20,000 titles in print. But we recently expanded the D2D Print beta to include authors outside North America (having resolved issues with the cost of shipping author copies from the US to other continents), and so this is only going to continue to grow.
Authors who sign up to be opted into the beta program are now waiting less than a week to get into it. (If you’ve opted in and haven’t seen an invite, check your spam filter, or just email support@draft2digital.com and we’ll get you sorted out)
Smashwords
One of the things authors often forget is that Smashwords hasn’t just been an aggregator and distributor; it has been a store. And a global store. With customers in countries well beyond the reaches of the world’s longest river.
In future reports, we’ll dig a bit more into Smashwords sales. But in the meantime, here’s a quick look at some trends that the Smashwords store has been seeing.
- Not only are Smashwords Store sales up 4.26% over 2021, but 2022 is the 6th consecutive year that Smashwords Store sales are growing.
The Smashwords store has long been the world’s largest exclusively indie author catalog of titles, available in more countries than Amazon. And, in a year where the trend, overall, has been a decrease in YoY sales, to see the Smashwords store sales bing up more than 4 percent says that customers at that store are not slowing down their purchases.
- Authors earn far more on the Smashwords store than they do on any other major retailer
Authors who publish to the Smashwords store earn 80% of the retail price. That’s 10% higher than the 70% you get when publishing direct to those platforms, and 20% higher than the royalties earned when you distribute from Smashwords or Draft2Digital to a retailer.
And, yes, the team is working hard at Phase 1 of the merger to allow authors in D2D the ability to press a button and get their D2D titles listed to the Smashwords store – that’s coming as the first step in many merger plans.
In the meantime, if you’re worried about your sales, we advise you to stay the course, find a way to practice patience and employ long-term thinking to your strategy as we’re heading into the fall and holiday seasons. In traditional bookselling, the last quarter of the year is usually where the majority of the money is made. Even if it’s a slightly slower sales year, due to trying economic conditions, remember what Lou Aronica said: People who love reading and books, really love reading and books and define themselves as readers and book people. And you, dear author, are in the business of providing them that commodity they so want, that they so crave, that they so cherish.
For Industry Insights from the first Quarter of this year, check out our previous Industry Insights.